
Two-way Analysis of Variance (ANOVA2)
For data sets with two factors the ANOVA2 can be a powerful statistical tool. For example, we may hypothesize that happiness scores vary by gender (male or female) and socioeconomic bracket (lower-, middle-, and upper-class), or that levels of water pollution in reservours differ by season (winter, spring, summer, and fall) and the local community type (village, town, or city). Similar to the ANOVA1, the ANOVA2 has the following assumptions:
- The data are continuous,
- the observations are randomly sampled from the population,
- each factor is approximately normally distributed,
- there are no significant outliers or high-leveradge points,
- and there are equal variances among the groups.
The ANOVA2 tests the following null and alternative statistical hypotheses for each factor and their interaction:
-
Is there a difference in the population means for Factor A (α)?
H0: α1 = α2 = … = αn HA: at least one αi is not equal to at least one other αi
-
Is there a difference in the population means for Factor B (β)?
H0: β1 = β2 = … = βn HA: at least one βi is not equal to at least one other βi
-
Is there an interaction between Factors A and B?
H0: Factors A and B do not influence one another HA: Factor A is influenced by Factor B, and vice versa
The ANOVA method calculates what is known as a F-statistic by:
- calculating the sum of squares (SS) differences between each of the two factors A and B (SSA and SSB), the SS for the interaction between factors A and B (SSAB), within each group (SSW also known as SSE for error sum of squares), and the total sum of squares (SST), which for the ANOVA1 are the sum of the between- and within-group SS,
- determining the degrees of freedom (df),
- calculating the mean squared errors (MSE) by dividing each SS by their respective df,
- calculating an F-value by dividing the MSE for the between groups with the MSE for the within groups.
An example ANOVA1 table and the formulas for each calculation is:
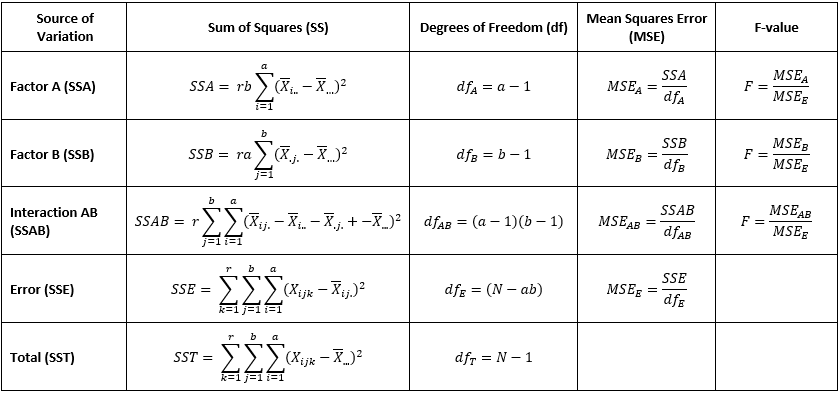
From the F-value, an approximated p-value is then derived from the F-distribution. A p-value that falls below the chosen statistical threshold (typically α = 0.05) is considered statistically significant, where the null hypothesis can be rejected in favor of the alternative.
Note that the primary purpose of using an ANOVA2 over two separate ANOVA1s for each factor is to test whether there is an interaction between those two factors and should be checked first in the results. A statistically significant interaction term would indicate that Factor A influences Factor B (and vice versa), thus interpreting the other effects would be misleading. Post-hoc tests, such as Tukey’s Honestly Significant Difference (HSD) test, can report the simple main effects of the interaction, or the difference in Factor A at each level of Factor B and the difference in Factor B at each level of Factor A.
If the interaction term is not significant, then you do not need to run a new model without the interaction term but can continue with interpreting the main effects. The ANOVA2 does not indicate which group means differ from one another, only that at least one of the group means are different statistically. To determine which specific group means statistically differ then a post-hoc pairwise comparison test is needed. Tukey’s HSD test is most valid when the assumption of equal variance is valid, otherwise the Games-Howell post hoc test may be more appropriate. Alternatively, pairwise t-tests using the Bonferroni, Benjamini-Hocheburg, Waller-Duncan, or a number of other multiple test correction methods can be used.