
One-way Analysis of Variance (ANOVA1)
The ANOVA1 is a commonly used method for statistically comparing the means of some continuous measurement between more than two groups. For example, we may want to know if four native species of trees accumulate Lead differently from contaminated soil, or whether the expression of some protein differs in endothelial cells provided three separate treatments. The assumptions of the ANOVA1</sub> include:
- the data are continuous,
- the observations are independent,
- each factor is approximately normally distributed,
- there are no significant outliers or high-leveradge points,
- and the distributions of the factors have equal variances.
If the assumptions that the groups follow an approximately normal distribution is violated or if there are significant outliers then rank-based, non-parametric tests, such as the Kruskal-Wallis test, may instead be valid. Additionally, while the assumption of equal variances can at times be violated, when the ANOVA1 design is unbalanced (the groups have different numbers of observations) then non-parametric tests may also be preferred.
The ANOVA1 tests the null and alternative statistical hypotheses:
The ANOVA method calculates what is known as a F-statistic by:
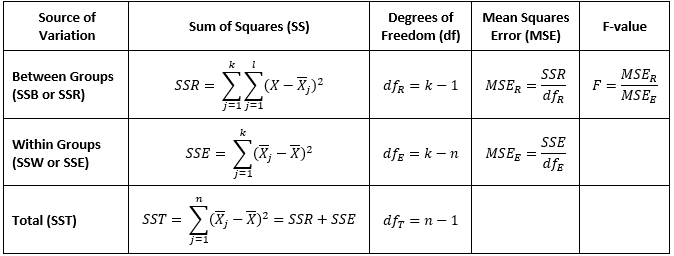
- calculating the sum of squares (SS) differences between each group (SSB also known as SSR for regression sum of squares), within each group (SSW also known as SSE for error sum of squares), and the total sum of squares (SST), which for the ANOVA1 are the sum of the between- and within-group SS,
- determining the degrees of freedom (df),
- calculating the mean squared errors (MSE) by dividing each SS by their respective df,
- calculating an F-value by dividing the MSE for the between groups with the MSE for the within groups.
An example ANOVA1 table and the formulas for each calculation is:
From the F-value, an approximated p-value is then derived from the F-distribution. A p-value that falls below the chosen statistical threshold (typically α = 0.05) is considered statistically significant, where the null hypothesis can be rejected in favor of the alternative. However, the ANOVA1 does not indicate which group means differ from one another, only that at least one of the group means are different statistically. To determine which specific group means statistically differ then a post-hoc pairwise comparison test is needed.
The most common post-hoc pairwise comparison test is Tukey’s Honestly Significant Difference (HSD) test (which does not need to follow a statistically significant ANOVA1 result as the test already controls for Type I errors). Tukey’s HSD test is most valid when the assumption of equal variance is valid, otherwise the Games-Howell post hoc test may be more appropriate. Alternatively, pairwise t-tests using the Bonferroni, Benjamini-Hocheburg, Waller-Duncan, or a number of other multiple test correction methods can be used.